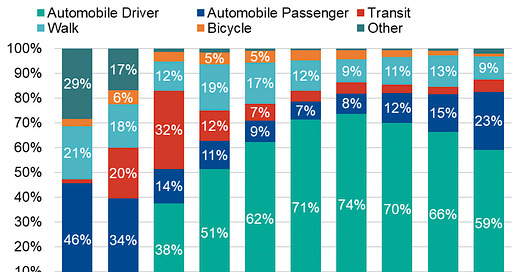
Earlier this month Ottawa transportation planners released the long-awaited results of the 2022 Origin-Destination study, and it’s full of fascinating info about how transportation patterns are changing in Ottawa post-pandemic. If you like charts and stats about travel and mobility, this post is for you.
Background
The 2022 Origin-Destination Study was a massive survey that tracked the daily travel of nearly 70,000 residents from urban, suburban and rural neighbourhoods. The last survey of its type was done in 2011 and since then we’ve seen big changes: launch of the LRT; construction and expansion of roads; and of course the shift to work-from-home and hybrid work.
The data is summarized in three reports available at engage.ottawa.ca. There’s a full Transportation Trends Report, a quick-read Highlights document, and a Needs, Opportunities and Uncertainty Report that examines how the data could be used as the City plans for future transportation needs. All of this will feed into the update to the Transportation Master Plan, to be completed in 2025.
There’s so much info to chew on, so I’ll break it down into smaller bites:
Part 1: Overall trends (this post)
We’re travelling less
Ottawa’s population grew 15% in the decade from 883,000 in 2011 to 1,017,000 people in 2021. Despite that, the number of daily trips has actually decreased by about 0.7% from 2.55-million to 2.54-million in roughly the same timeframe. That’s a remarkable drop.1
The reduction has been even greater in the morning peak hours (6:45 a.m.-9:00 a.m.), which went from 532,400 trips in 2011 to 487,600 in 2022, a decline of 8%.
We’re moving around less, on average. The average Ottawa resident made 2.50 trips each day in 2022, compared to 2.76 trips in 2011.
Not surprisingly, trips to work saw the biggest decrease of any category of travel.
The pandemic changed travel behaviour
Of course it did. But it’s rebounding more than I would have guessed. Morning peak hour automobile traffic has rebounded to 85% of pre-pandemic levels as of Fall 2022. Transit ridership increased more slowly, reaching about 75% of pre-pandemic passenger volume by December 2023.2

Cost of travel, between 2011-2022
The Consumer Price Index (CPI) increased by 26%.
Average hourly wage grew by 11%.
Gasoline prices rose by 30%.
Adult monthly bus pas prices rose by 5%.
Single trip adult fares increased by 12%.
Demographics and transportation
Age, gender and income have a big impact on travel.
People living in lower income households are more likely to use transit and to make longer duration trips.
People living in households making less than $35,000 per year are four times more likely to take transit and almost 50% more likely to use active modes3 than those living in households earning more than $150,000 per year.
A significant area of growth in the coming decades will be the student population. The total number of post-secondary students is forecasted to increase by more than 30,000 by 2046. Similarly, high school enrolment is also expected to grow by nearly 28,000 by 2046. This group has historically relied more on transit and active transportation.
Males are more likely to drive than females, while females are more likely to be a passenger. Males are more likely to cycle (66% of cyclists are male), while females are slightly more likely to walk and use transit.
Between 2011 and 2022, the number of people 60 and older increased by 46%. As the population ages, our transportation needs will continue to change. For example, for people aged 20-59, 31% of trips are conducted for work and 21% are for shopping. For people aged 60-69, 18% of trips are conducted for work and 38% are for shopping.
Also, 18% of people over 70 do not have a driver’s license. (Compared to 12% of people aged 16-69 who do not have a driver’s license.)
Get involved
The City has launched another round of consultation for the Transportation Master Plan. Residents are invited to provide input on the transportation challenges they experience when travelling by car or transit, as well as their transportation investment priorities. Fill out the surveys before August 30, and sign up for updates at https://engage.ottawa.ca/transportation-master-plan
The City will also host an online virtual public engagement on Wednesday, June 26 from 6pm to 8pm. To register and to find out more information about the project, visit https://engage.ottawa.ca/transportation-master-plan
Next in this series: Where are people going?
Had trips increased at the same rate as population, we would have expected to see 2.93-million trips per day.
Some individual OC Transpo bus routes have seen passenger volume recover to 90% or more of pre-pandemic levels. Meanwhile, LRT ridership recovery is considerably less than 75%. More about that in Part 4.
Active transportation in this study includes walking and cycling, as well as travelling with a mobility aid or wheelchair, pushing a stroller, or other forms of active mobility.


