


Transportation trends in Ottawa (Part 3)
What the survey says about vehicle ownership

Last month Ottawa transportation planners released the long-awaited results of the 2022 Origin-Destination study, and it’s full of fascinating info about how transportation patterns are changing in Ottawa post-pandemic. The reports are available at engage.ottawa.ca.
I’m diving in to the data in four parts.
Part 3: Vehicle ownership (This post)
What the data says about car ownership
This was one of the sections of the report I was most anxious to see. As a suburban councillor in Stittsville and as a member of Planning & Housing Committee, parking is often a key point of discussion.1 How much parking do we need for a new home downtown or in the suburbs? Until now, the main data available on car ownership was from the 2011 Origin-Destination study.
Here’s what the 2022 study tells us:
The average number of cars per household city-wide has remained relatively stable at 1.34 in 2011 and 1.33 in 2022.
In 2011, 16% of households did not own a car, which decreased to 14% of households in 2022.
Not surprisingly, there are big differences in different areas of the city.
")
If I had a dollar for every time someone told me that every family in the suburbs has two cars…
Nearly half (48%) of suburban households have one or zero vehicles, and that percentage has increased from 2011 to 2022.
The report doesn’t identify why we’re seeing this trend in the suburbs, but I would guess a big factor is that household car ownership tends to decline along with an aging population.2 The increasing cost of owning and operating a vehicle may also be a factor3, along with more people working from home – although it’s probably too early to see how work-from-home is impacting car ownership, since people tend to hang onto vehicles for a number of years.
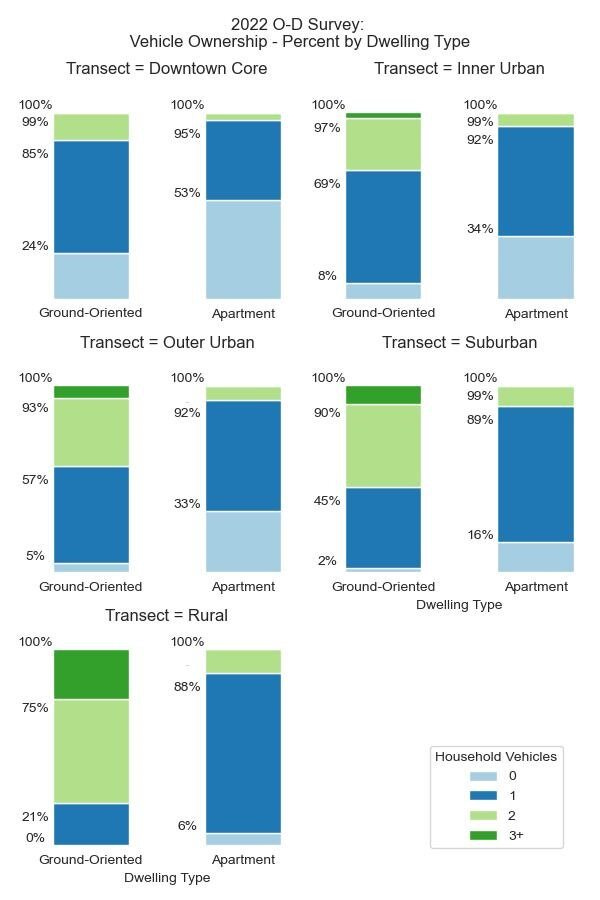
My council colleague Jeff Leiper posted this additional chart that breaks down vehicle ownership by transect. In the suburban transect (which includes Stittsville), 16% of apartment dwellers4 are car-free, and 73% have one vehicle. Only 11% of apartment dwellers have two or more vehicles.
Meanwhile, 1 in 10 suburban households have three or more vehicles.
This is all useful data as we’re developing our new Zoning By-law, which could include eliminating minimum parking requirements across the city.
Bicycle ownership
Bicycle ownership data was collected for the first time in the 2022 survey.
The report says bike ownership is consistent and vehicle ownership across the City, with more ownership outside the downtown core.
Downtown: 59% of households own at least one bike.
Rural area: 75% of households own at least one bike.
Citywide, 3.8% of households own an e-bike.
Car sharing
Car sharing arrived in Ottawa nearly 25 years ago with VRTUCAR in Centretown. The company was eventually purchased by Montreal-based Communauto and they continue to expand but they’re not in the suburbs yet.
Areas with lower car ownership have the highest car share membership rates, with 14% of households in the downtown core and 6% of households in the inner urban area having at least one person belonging to a car share program.
Next in this series: What the OD survey tells us about transit.
Fun fact: In Q2 2024 there were 386 calls about parking infractions made to Ottawa by-law in Stittsville, and 10,468 calls about parking city-wide. That’s more than any other category of by-law cases.
The study tells us that between 2011-2022, the number of people 60 or older increased by 46%. And 18% of people over age 70 do not have a driver’s license. Ottawa’s population will continue to get older in the coming decades.
See also: Turo 2024 Car Ownership Index. According to this survey, 12% of Canadians (and 17% of millennials) are planning to stop owning a car in the future, and of those, 42% say it’s due to the cost.
“Apartments” includes apartments and condos, rented or owned.